
Transparency reporting requires online services to disclose how they keep users safe: how harmful content is detected, how much is acted on, how quickly user reports are handled and what resources go into safety. Its purpose is accountability, giving regulators, researchers and the public a view of practices that are otherwise internal. A growing number of regimes require it, including the EU’s Digital Services Act (DSA) and Australia’s Online Safety Act. For platforms, the published results are also one source of public information on how peers operate, and reading regimes side by side gives a fuller picture than any one of them alone.
Since 2022, Australia’s eSafety Commissioner has used transparency notices under the Basic Online Safety Expectations (BOSE) to ask online services how they detect and respond to harms, from child sexual exploitation and abuse (CSEA) and terrorist and violent extremist material (TVE) to risks for children on social media, AI companion apps and online games. Unlike the DSA’s common template, eSafety sends targeted notices on a specific area to a selected group of services. It then publishes a summary of the responses in a report, which makes it possible to compare services on the same questions.
Although each report focuses on a different harm, a recurring set of findings runs across them, relating to the operational side of trust and safety: how harm reaches teams, whether the action they take holds against repeat offenders, and who does the work. In this piece, we look at the findings across these three themes, compare them where possible with DSA data, and consider what they may mean for platforms.
1. User report handling and access vary across services
User reporting comes up in almost every report by eSafety, with two points commonly highlighted.
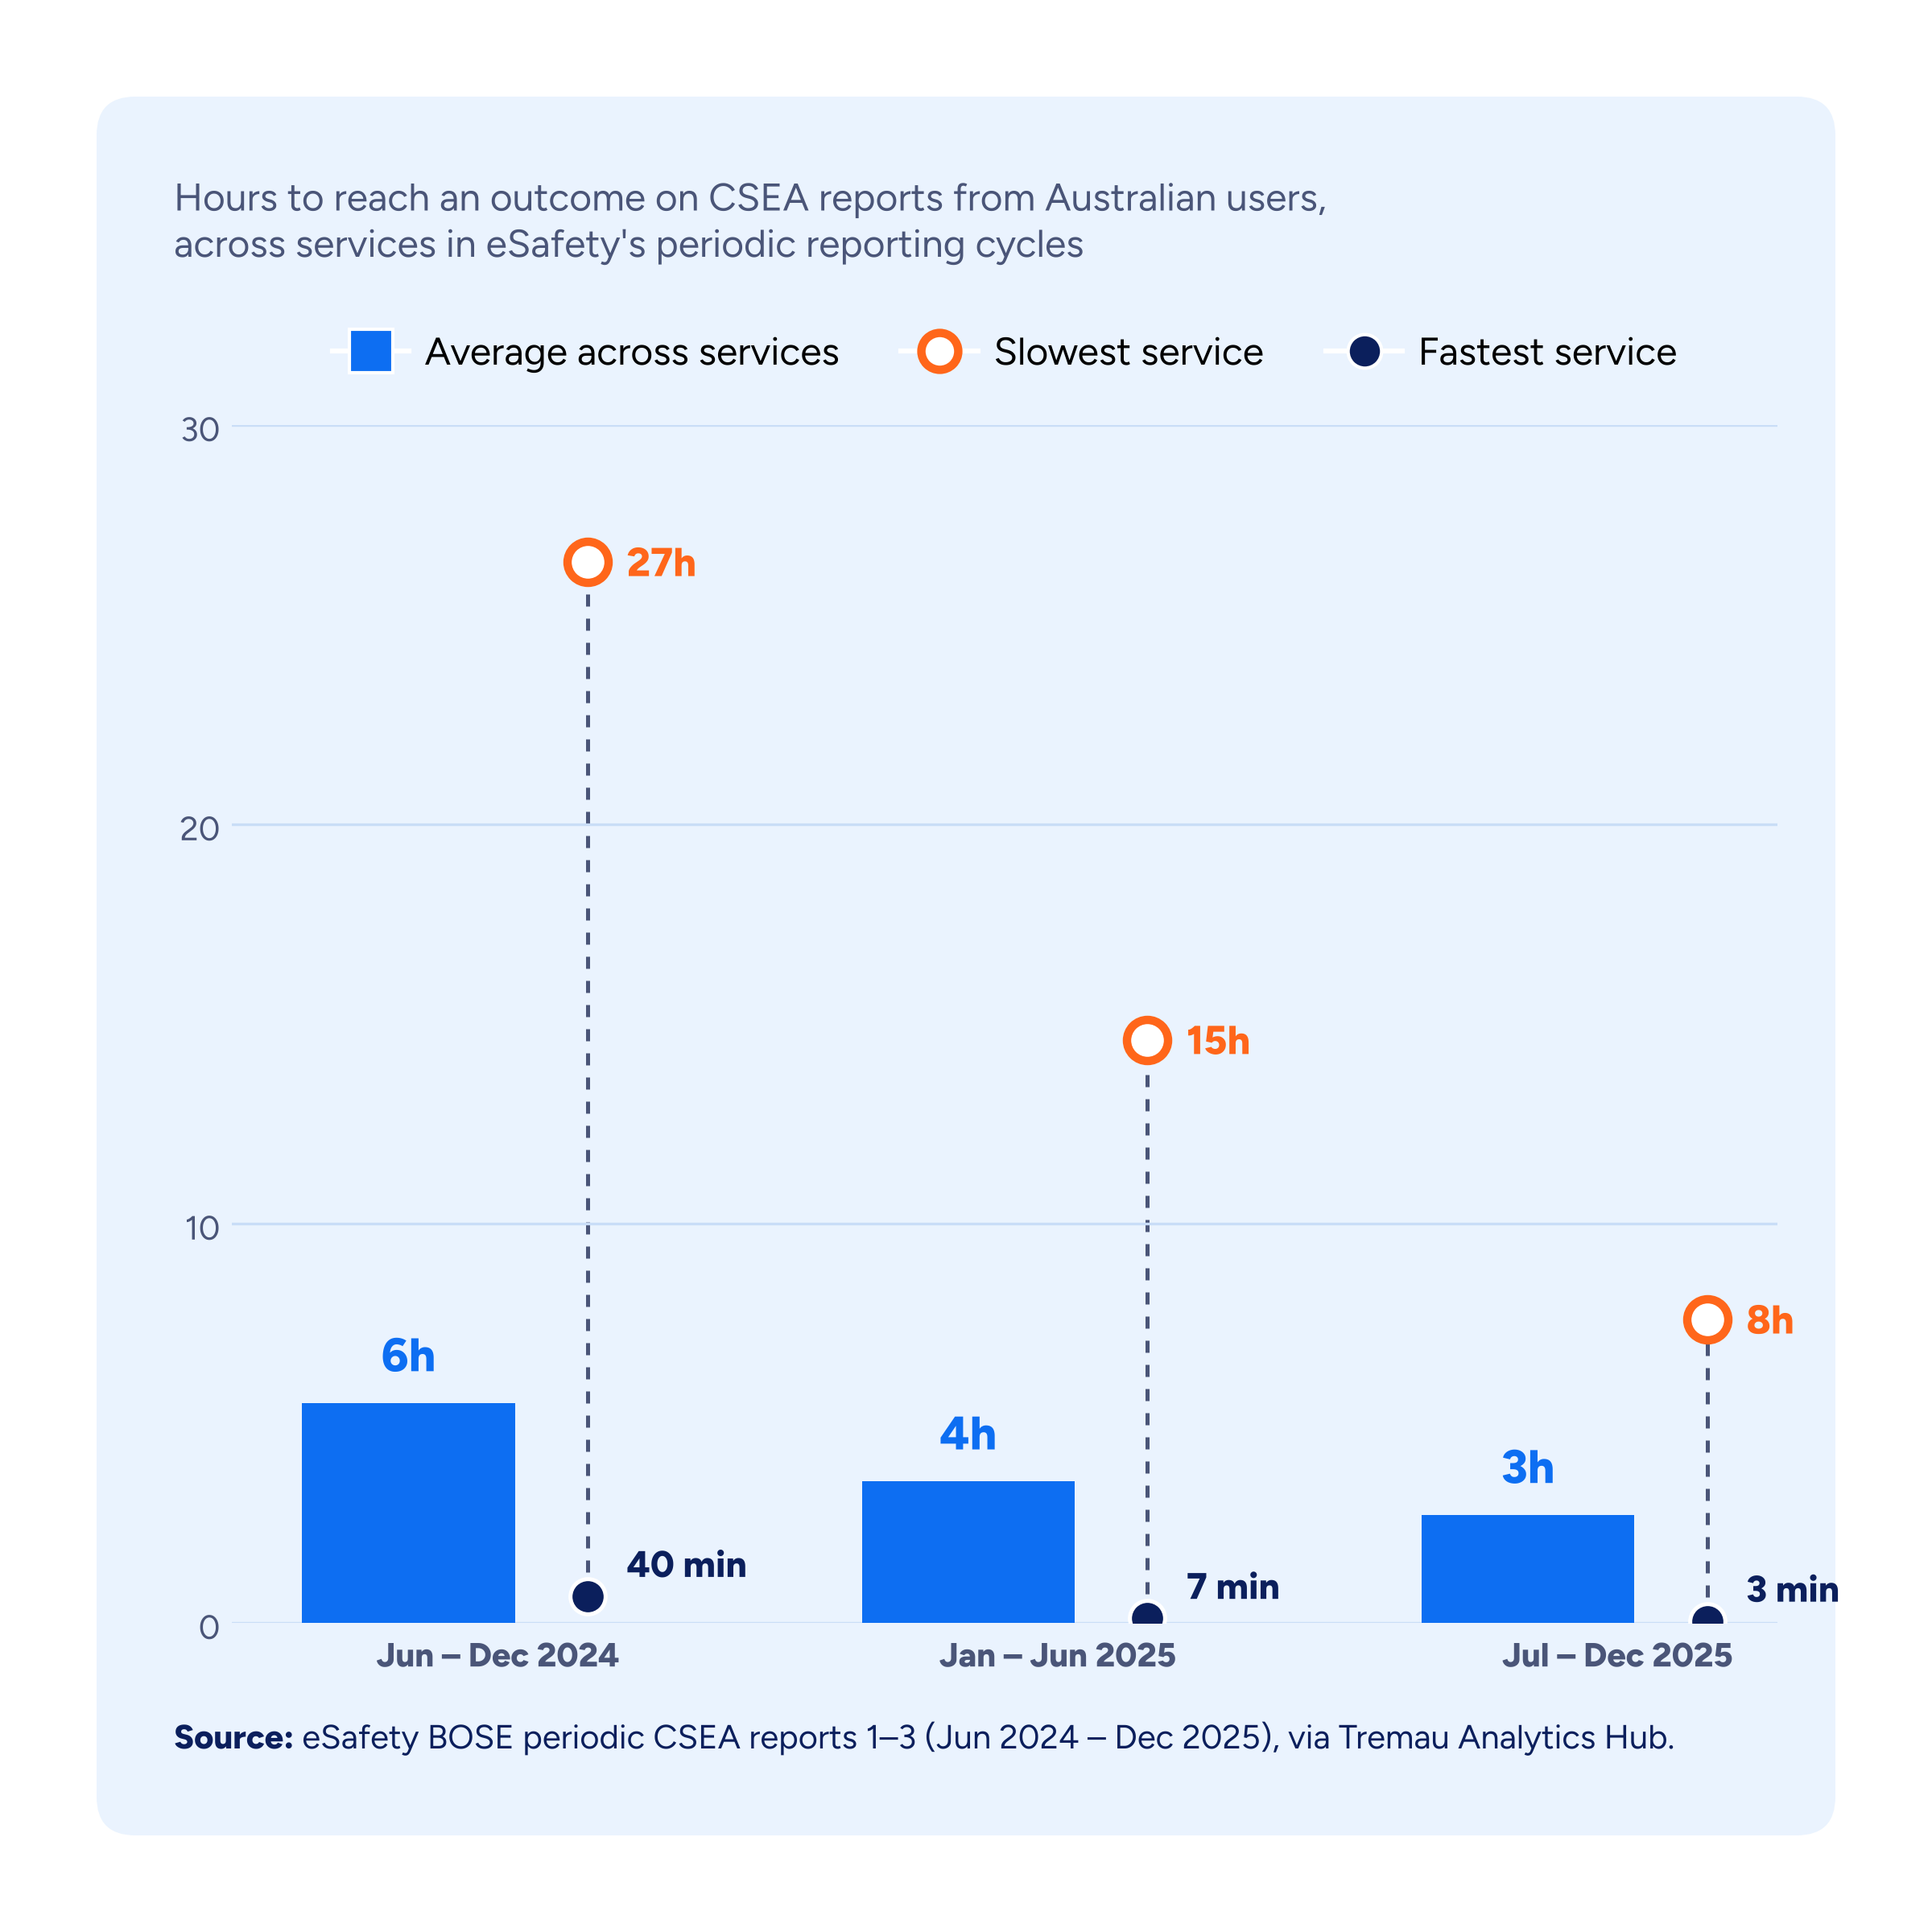
First, response times vary widely across platforms and over time. Median times to outcome on user reports ranged from a few minutes to two days or more. Across services, however, the trend has been towards faster responses in some harm areas. eSafety’s periodic CSEA reports, show the average time to outcome on user reports from Australian users roughly halving between June 2024 and December 2025, from 5.5 to 2.7 hours. The gap between services also narrowed: the slowest services went from around 27 hours to under 8 hours, while the fastest acted within minutes. Across different reports, eSafety notes that when harmful content is reported, verifying it and taking action should be done quickly to prevent ongoing or new harm. It notes that slower responses “can leave users exposed to serious harms for longer”.
DSA data also focuses on speed in Europe. Across the past two reporting cycles, user report volumes on social media platforms rose by 23%, while median response times fell from 2.7 to 1.2 days. On marketplaces, volumes fell and response times stayed broadly stable at around ~3.2 days.
The second area highlighted in terms of user reporting relates to ease of access. Data shows that reporting is not always available or easy to use. Some services had no in-service reporting on parts of their service, required users to be signed in, limited which accounts could be reported, or relied on complicated webforms. eSafety named services offering in-service reporting on multiple parts of the service, with specific categories, as best practice.
For platforms, reporting flows and response times are among the most visible parts of transparency reporting. Reviewing reporting flows against the questions eSafety asks, such as whether reporting is available on every part of the service, whether there are specific categories and how many steps it takes, can help teams benchmark their approach against peers and identify where reporting could be made easier for users. Tracking response times alongside staffing levels can also show where a platform stands on speed compared with peers, and support reporting to leadership on how changes to teams or tooling affect how quickly users are protected. Because services measure response times differently, consistent definitions matter if figures are to be compared, whether internally over time or externally against peers.
2. Enforcement against repeat offenders is uneven across platforms
Acting on a report quickly is one part of the picture. The next question is whether enforcement holds, or whether repeat offenders can evade a ban by creating new accounts or moving to another service. We can look into two questions from the reports here: whether services can stop banned users from re-registering with new details, and whether information about bans is shared across a provider’s own services and with the wider industry. The answers show wide variation from the first report to the latest. Across the report that covered this, some services checked multiple signals to detect returning users, while others used only a few. In the children and social media report, five of eight services used signals from banned under-13 accounts to stop those users signing up again. Information sharing was also uneven. Within one group, ban information was shared between services in one direction but not the other. In the online games report, participation in cross-industry information-sharing initiatives ranged from several programmes to none. On community-moderated services, trust and safety staff were not always told when volunteer moderators removed someone, so a user banned from one group could stay active elsewhere on the same service. eSafety notes that the fewer signals a service uses, “the more likely it is that perpetrators can return”, and that information a provider holds about abuse on one service should be used to prevent the same abuse on its other services. The online games report adds that moving between connected services is “an ordinary part of the user experience”, so harm can move with users unless services share what they know.
Comparing the signals used to detect returning users, and whether ban information flows across a provider’s services, can help teams benchmark their approach against peers, identify gaps, and make the case internally for investment in detection or signal-sharing initiatives. It may also help them anticipate where regulators are likely to focus next, as attention shifts from how many accounts are actioned to whether enforcement prevents repeat offending.
3. Staffing is increasingly read against platform size, not headcount alone
Both how quickly reports are handled and whether enforcement holds depend on the people behind them. The reports, which largely report data on this metric on a global scale, show trust and safety staffing moving in both directions. Some providers reported cuts in 2022 and 2023. More recent periodic data shows a mixed picture: overall moderator numbers were broadly stable in 2025, with some services reducing their teams and others growing them.
Earlier Australian reports presented staffing as headcounts and changes over time. More recently, eSafety has started to read these numbers in relation to users and outcomes. The AI companion report noted that one provider’s trust and safety team was limited “particularly given the number of users”. The most recent online games report expressed staffing as a ratio to Australian users, from one trust and safety staff member per around 1,000 users to one per around 23,000. eSafety described low ratios as indicating “sizable risks”. It also linked slower response times to teams that were not “appropriately scaled to the size and activity of the user base”.
This confirms what we see in our work with platforms, and how we look at data in the Tremau Analytics Hub. The number of human moderators means little on its own. What matters is whether moderation capacity is proportionate to the size of the platform, the volume of reports and the harms it faces. A falling headcount can reflect greater use of automation or more efficient workflows, or it may leave reports waiting longer for review.
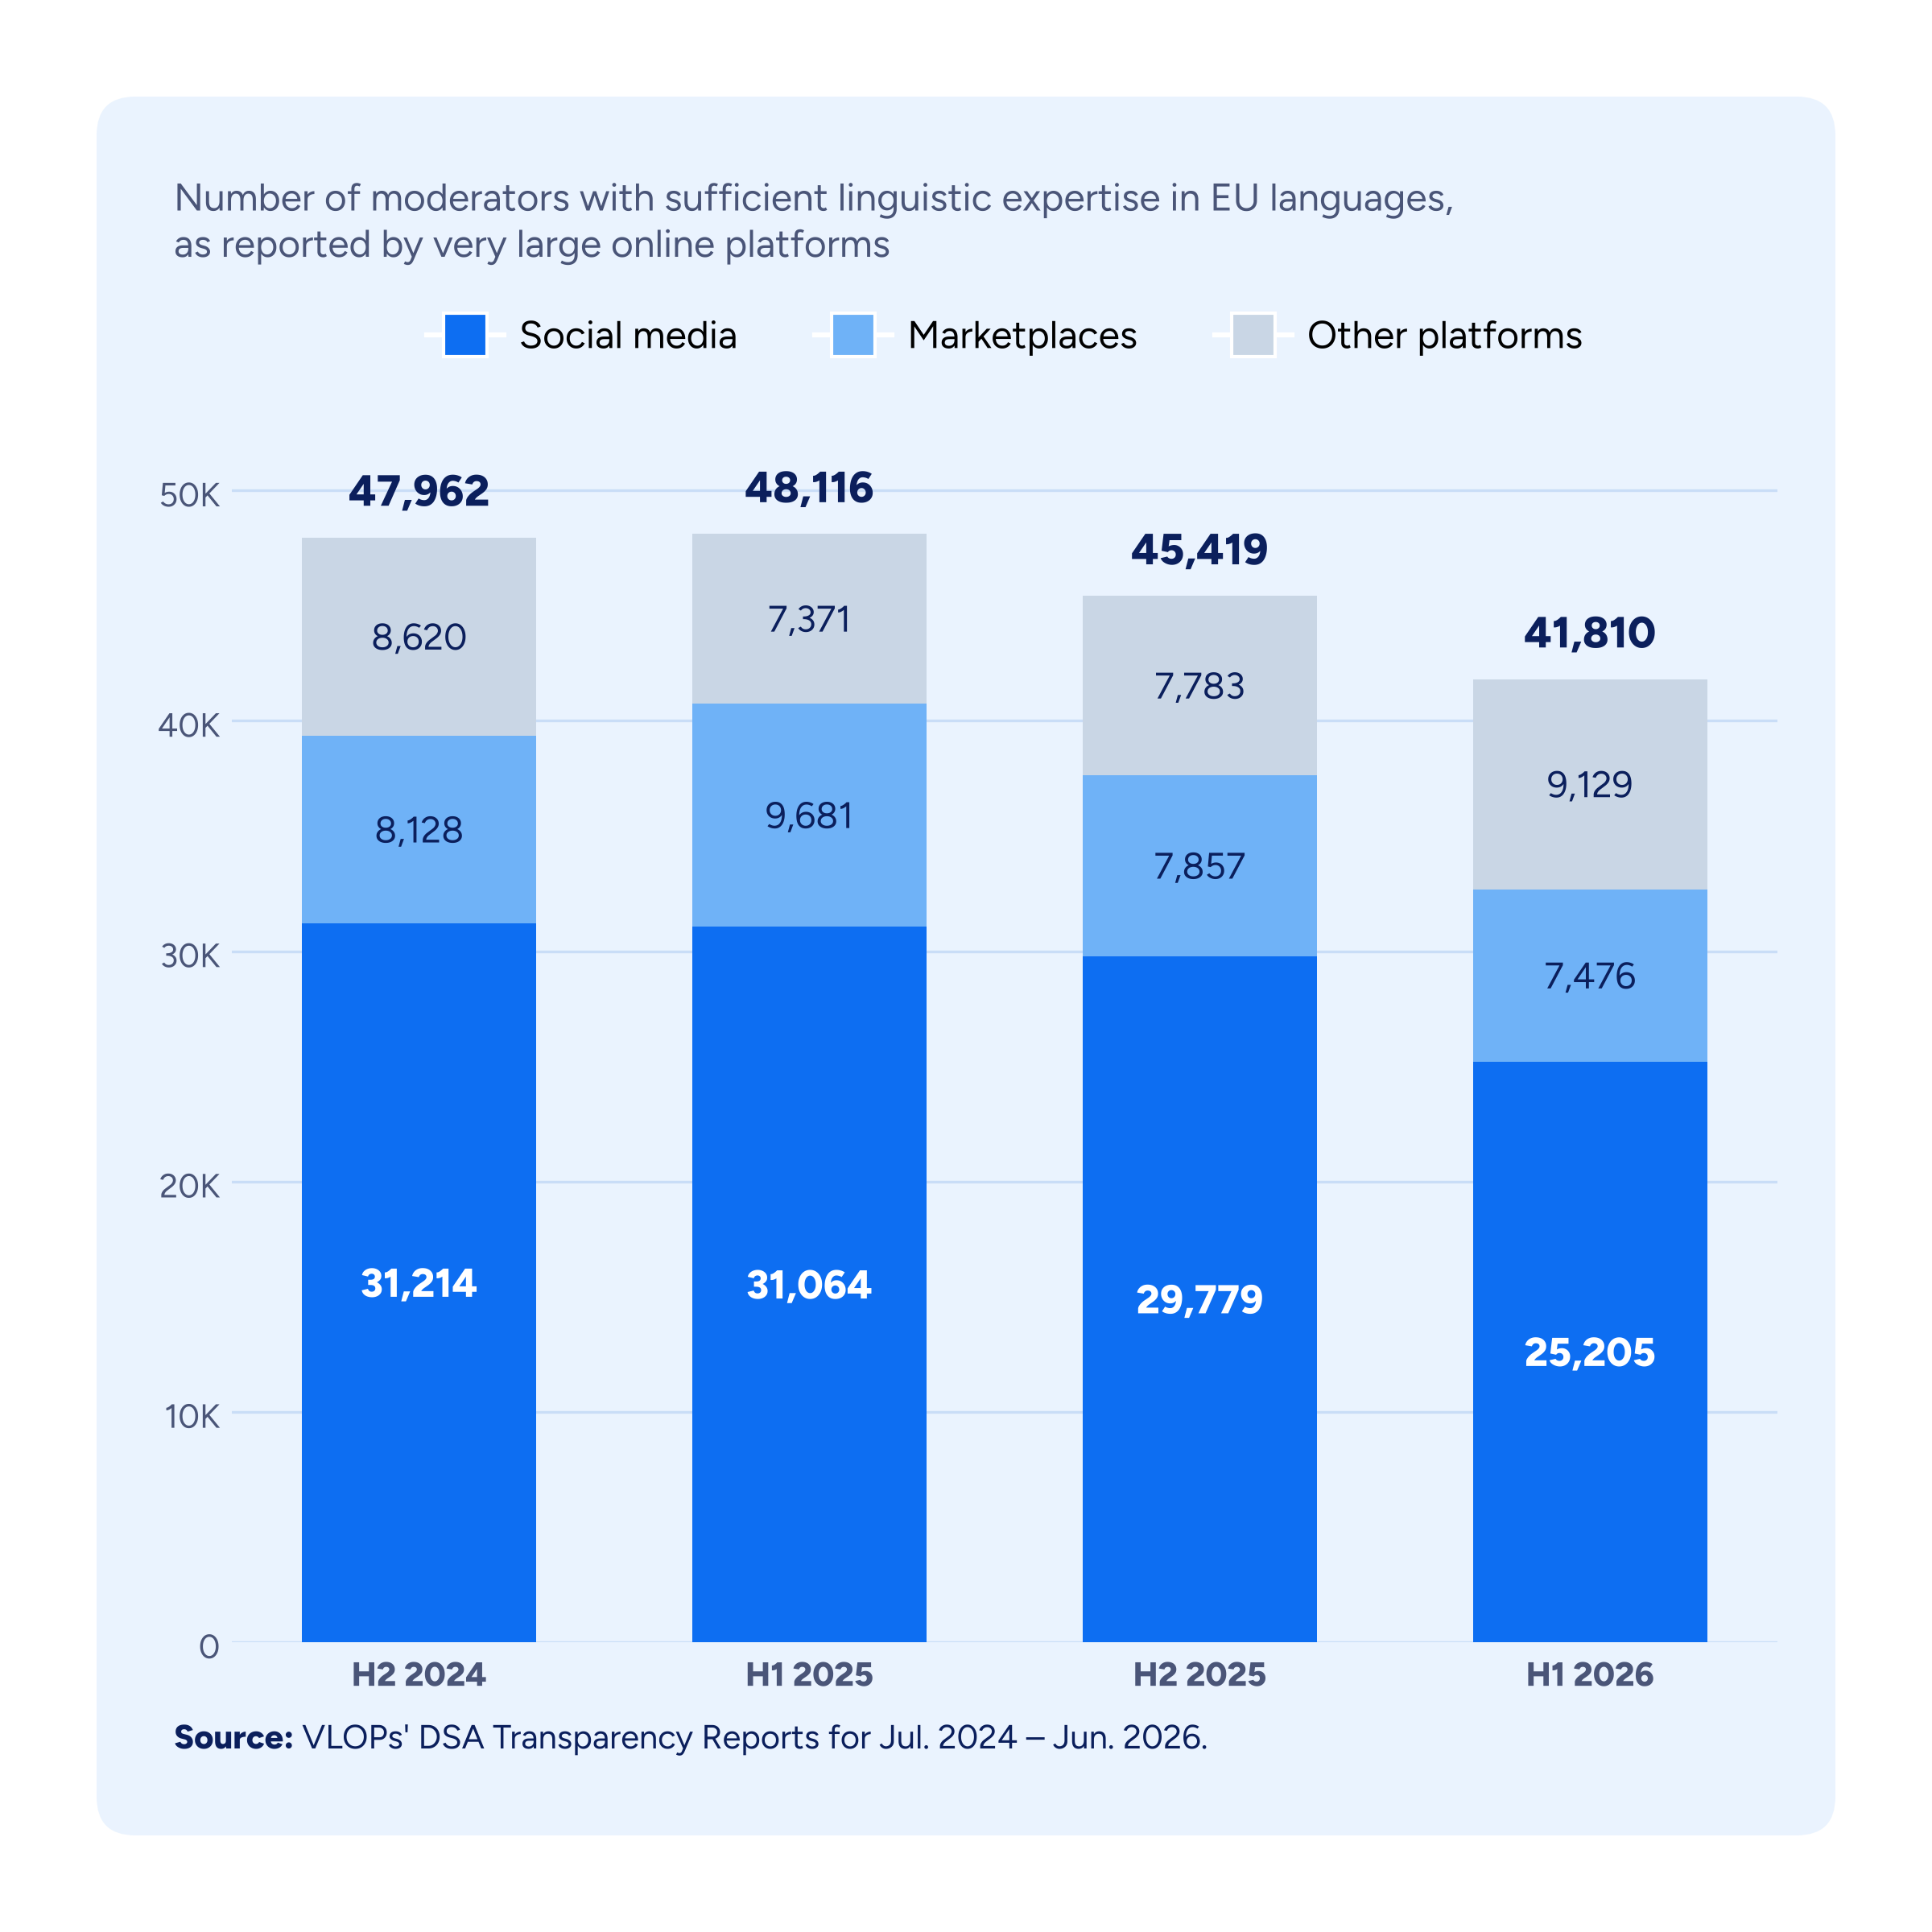
The Australian approach suggests regulators may increasingly look at staffing in proportion to the user base and alongside outcomes such as response times. DSA platforms already publish both moderator numbers and average monthly active users, so the same comparison can be made in Europe. Across the DSA transparency reports, the trend has been more downward, as reported moderators fell from ~48,000 to ~42,000 over the last two years. The decline was steepest among social media platforms (around 15% in the last cycle), while marketplaces were more stable (around 5%). For platforms, this makes it important to keep track of how addressing key harms and response times to reports have been shifting, particularly as teams and resourcing change.
Conclusion
The Australian reports offer a useful indication of how Trust & Safety operations could be assessed. Read alongside DSA disclosures and against peers, they can help teams benchmark their data against peers, communicate changes to leadership, and understand decisions they need to make on operations, resourcing, tooling, risk management and more. The data can also support platforms in anticipating the questions regulators are likely to ask.
Want to explore the data behind these trends? Explore the Tremau Analytics Hub to track eSafety and DSA transparency reporting and see how Trust & Safety practices compare across services and regimes.